Article
Draw Me a World Map: The Folk Test Chinese Users Built to Catch AI Getting Dumber
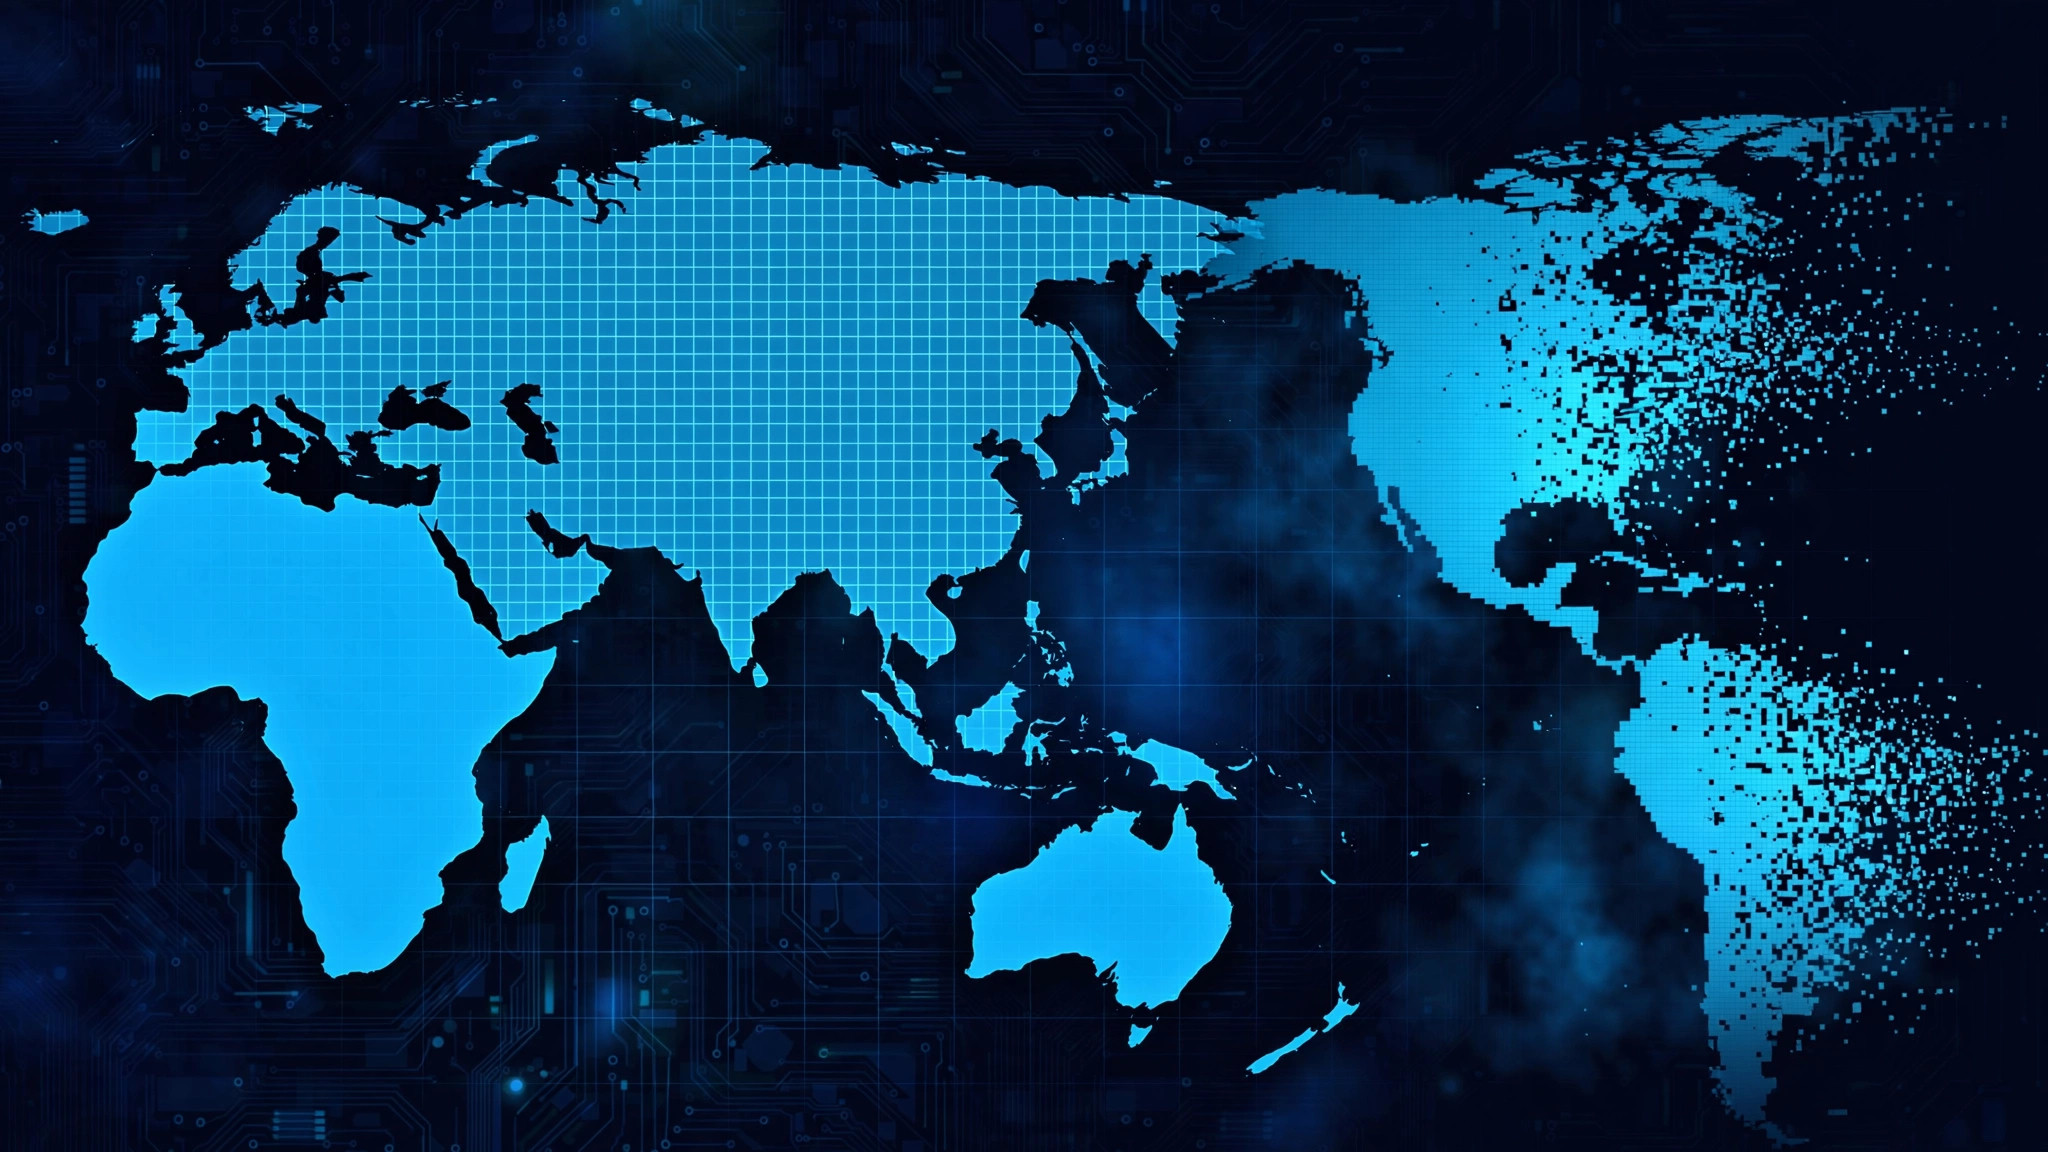
The prompt is deceptively simple. Ask your AI model to write a Python script that classifies 16,200 latitude/longitude points as land or water, saves the verdicts as a 90×180 grid in a CSV file, and renders the grid as a world-map image. A capable model hands you recognizable continents. A degraded one hands you something that looks like a Rorschach test with cartographic ambitions.
That exercise — dreamed up not by an AI lab but by users on LINUX DO, China's largest developer forum — has become a small folk ritual for answering one of the most anxious questions in the Chinese AI community: has my model gotten dumber? The Chinese word for it is 降智 — roughly, "degradation of intelligence" — and it names a suspicion no vendor benchmark has ever managed to kill: that the model answering you today is quietly worse than the one you met three months ago.
As described in the source discussion, the test works like this. You ask the model to produce one runnable script that:
The grid arithmetic is easy to check independently:
lats = list(range(89, -90, -2))    # 90 values
lons = list(range(-179, 180, 2))   # 180 values
assert len(lats) * len(lons) == 16200
Judging needs no scoring harness. You open the PNG and look at it. Sharp, plausible coastlines — Norway's fjords, the Indonesian archipelago, the ragged Mediterranean — mean the model still knows the world. Smudged blobs where South America should taper, or Africa fused to Eurasia, mean something has slipped. The forum's verdict on a good run is visual, immediate, and oddly satisfying: the continents either survive the rendering or they don't.
Most benchmark scores are numbers on a dashboard — abstract, vendor-supplied, and hard to argue with. The map test inverts all of that, and each inversion is deliberate:
That combination — multimodal in the old-fashioned sense (knowledge plus code), un-gameable, instantly legible — is why the thread caught on. It turns a vague feeling ("this feels worse than last month") into an artifact you can screenshot, rerun, and compare across models and across time.
To understand why Chinese users built this, you need the slang. 降智 (jiàng zhì) literally means a lowering of intelligence, and in AI circles it's the standard word for the suspicion that a model has been quietly made worse — throttled, cheapened, or lobotomized behind the same familiar interface.
This isn't a fringe conspiracy theory; it's mainstream enough to be covered by Chinese financial media. A 中新经纬 report documented users across DeepSeek, ChatGPT, Kimi, and Doubao reporting the same symptoms: answers that used to surprise now arrive as canned phrases, long-document tasks get refused where they once worked, context from two turns ago evaporates. One developer told the outlet his model wrote working code in one pass during the day but needed repeated fixes for similar tasks at night — a pattern that smells like load-dependent routing rather than broken weights.
Industry analysts quoted in the same report offer the unromantic explanation: brutal price wars (DeepSeek cutting flagship API prices by 75%, Xiaomi's MiMo series by up to 99%) push vendors toward cost controls — dynamic inference budgets, caching tricks, routing downgrades that protect overall throughput by quietly spending less compute per request. The user experiences "dumber"; the vendor experiences "sustainable margins." Model companies, for their part, counter that a released model's capability is fixed and perceived decline comes from version updates and context complexity — a disagreement the map test is designed to sidestep entirely.
That's the deeper function of the folk test. Official leaderboards measure what vendors choose to publish, on schedules vendors choose. The map test is an accountability ritual: a thing any user can run, that no vendor controls, producing evidence no changelog can contradict. When trust in the dashboard is gone, people build their own instruments.
You don't need the forum's exact prompt — the design is simple enough to reconstruct in your own words. Something along these lines works:
Write a single self-contained Python script (standard library plus numpy/matplotlib only) that builds a 90×180 grid of lat/lon points — latitudes 89 to −89 step 2, longitudes −179 to 179 step 2 — classifies each point as land (1) or water (0) from your own geographic knowledge, writes the matrix toworld.csv, and renders it asworld_small.png(180×90) andworld_big.png(1440×720). The script must run without modification.
Then run it locally, open the PNG, and compare. A few practical notes from the community's experience:
If you want the community's full discussion, parameter tweaks, and example outputs, the original thread is the place — it reads as a collaborative debugging session more than a benchmark spec, which is part of the charm.
Enthusiasm aside, the map test is a canary, not a laboratory. It's worth being precise about the limits:
| Official benchmark | Folk map test | |
|---|---|---|
| Who runs it | Labs, eval orgs | Anyone with a prompt box |
| What it measures | Narrow, standardized skills | World knowledge + code, fused |
| Gaming risk | High (train on the test) | Low (nothing to memorize) |
| Cost | Infrastructure | One prompt |
| Verdict style | A number | A picture you judge yourself |
| Blind spots | Vendor-controlled | Prompt-sensitive, single-axis |
The test won't tell you why a model degraded — shrunken inference budgets, a cheaper routing tier, and genuinely worse weights all smear coastlines the same way. It's sensitive to prompt wording, and a model can fail for boring reasons (no matplotlib in its mental sandbox, a refusal to guess at uncertain coastlines) that have nothing to do with intelligence. Treat a smeared map as a reason to investigate, not a conviction.
For a more structured take on community-built evaluation, see the Pelican test — another Chinese-community benchmark, but one with formal scoring where the map test has vibes. The two complement each other: Pelican gives you a number, the map gives you something to stare at.
The world-map test will never appear in a model card. No lab will cite it, no leaderboard will adopt it, and as a measurement instrument it's crude — one prompt, one picture, one pair of human eyes. That crudeness is the point.
Chinese AI users didn't build the map test because they needed another benchmark. They built it because they'd stopped trusting the existing ones — and the vendor explanations, and the silent updates, and the changelogs that say "improved performance" while the coastlines smear. The test is a trust technology disguised as a coding puzzle: a way for ordinary users to produce their own evidence about the tools they depend on.
So go ahead — ask your model to draw the world. Then look closely at the coastlines. The continents will tell you what the changelog won't.